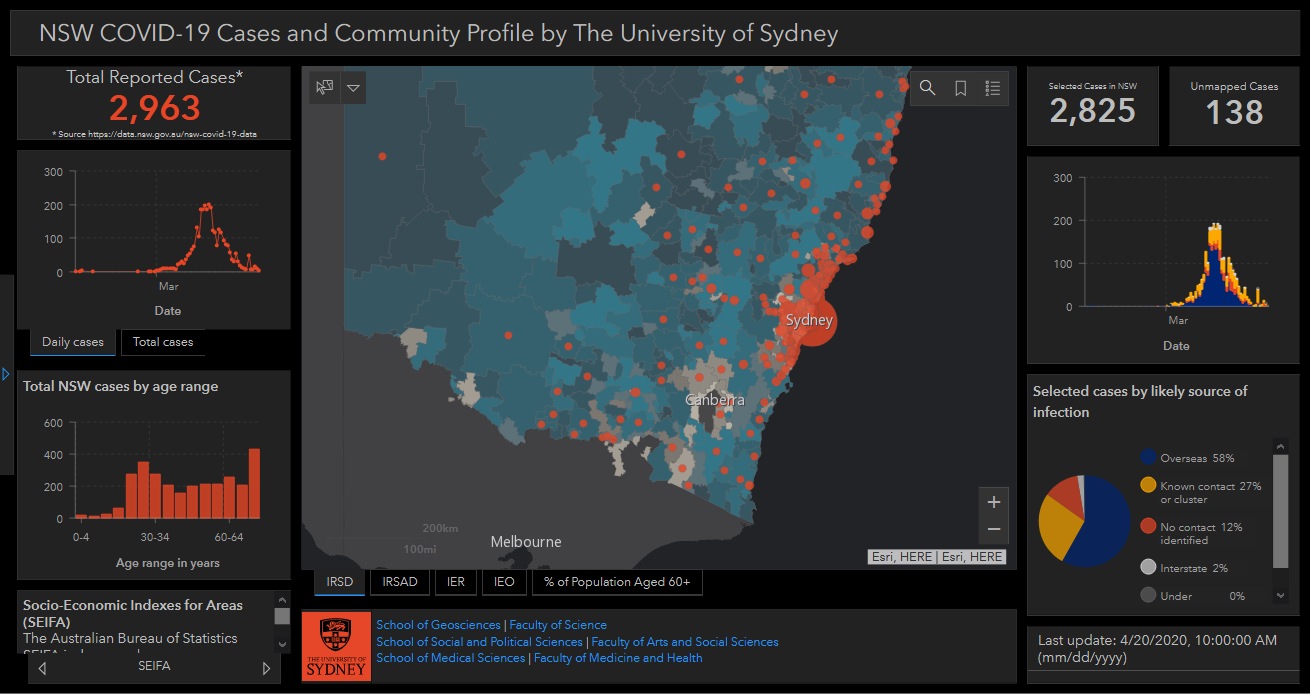
GIS dashboard linking COVID-19 reports with socio-economic disadvantage across NSW developed by CUAVA researchers
CUAVA researchers Kevin Davies, Jamie Simpson and Eleanor Bruce have developed a spatial dashboard that maps location of COVID-19 cases across NSW. This work is part of a research collaboration with Adam Kamradt-Scott (School of Social and Political Sciences), Dale Dominey-Howes (School of Geosciences) and Adam Dunn (Faculty of Medicine and Health). Data on infection notifications, likely source of transmission and testing have been mapped by postcode allowing trends to be summarised at local levels.
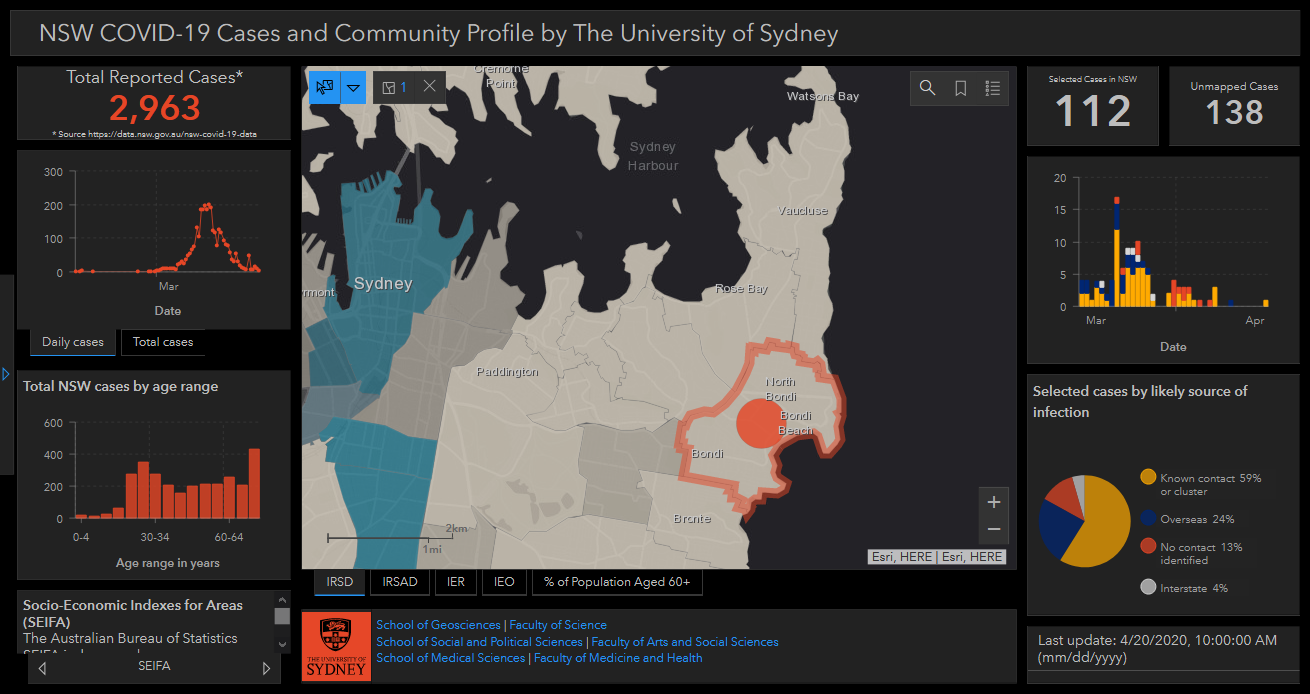
Understanding geographical differences in socio-economic disadvantage across NSW in the context of COVID-19 can help support vulnerable communities. These interactive maps are designed to convey this information in an accessible way that can engage the public and inform state policy responses to COVID-19, including allocation of resources. In presenting case trends in a spatial context, it is also possible to identify the location of disadvantaged communities who are potentially most impacted by the shutdown.
GIS-based analysis, modelling and visualisation can provide important insight on the spatial dynamics of outbreaks such as COVID-19 allowing geographical clusters and connectivity between areas to be investigated.
Funding declaration: The dashboard is wholly funded by the University of Sydney.